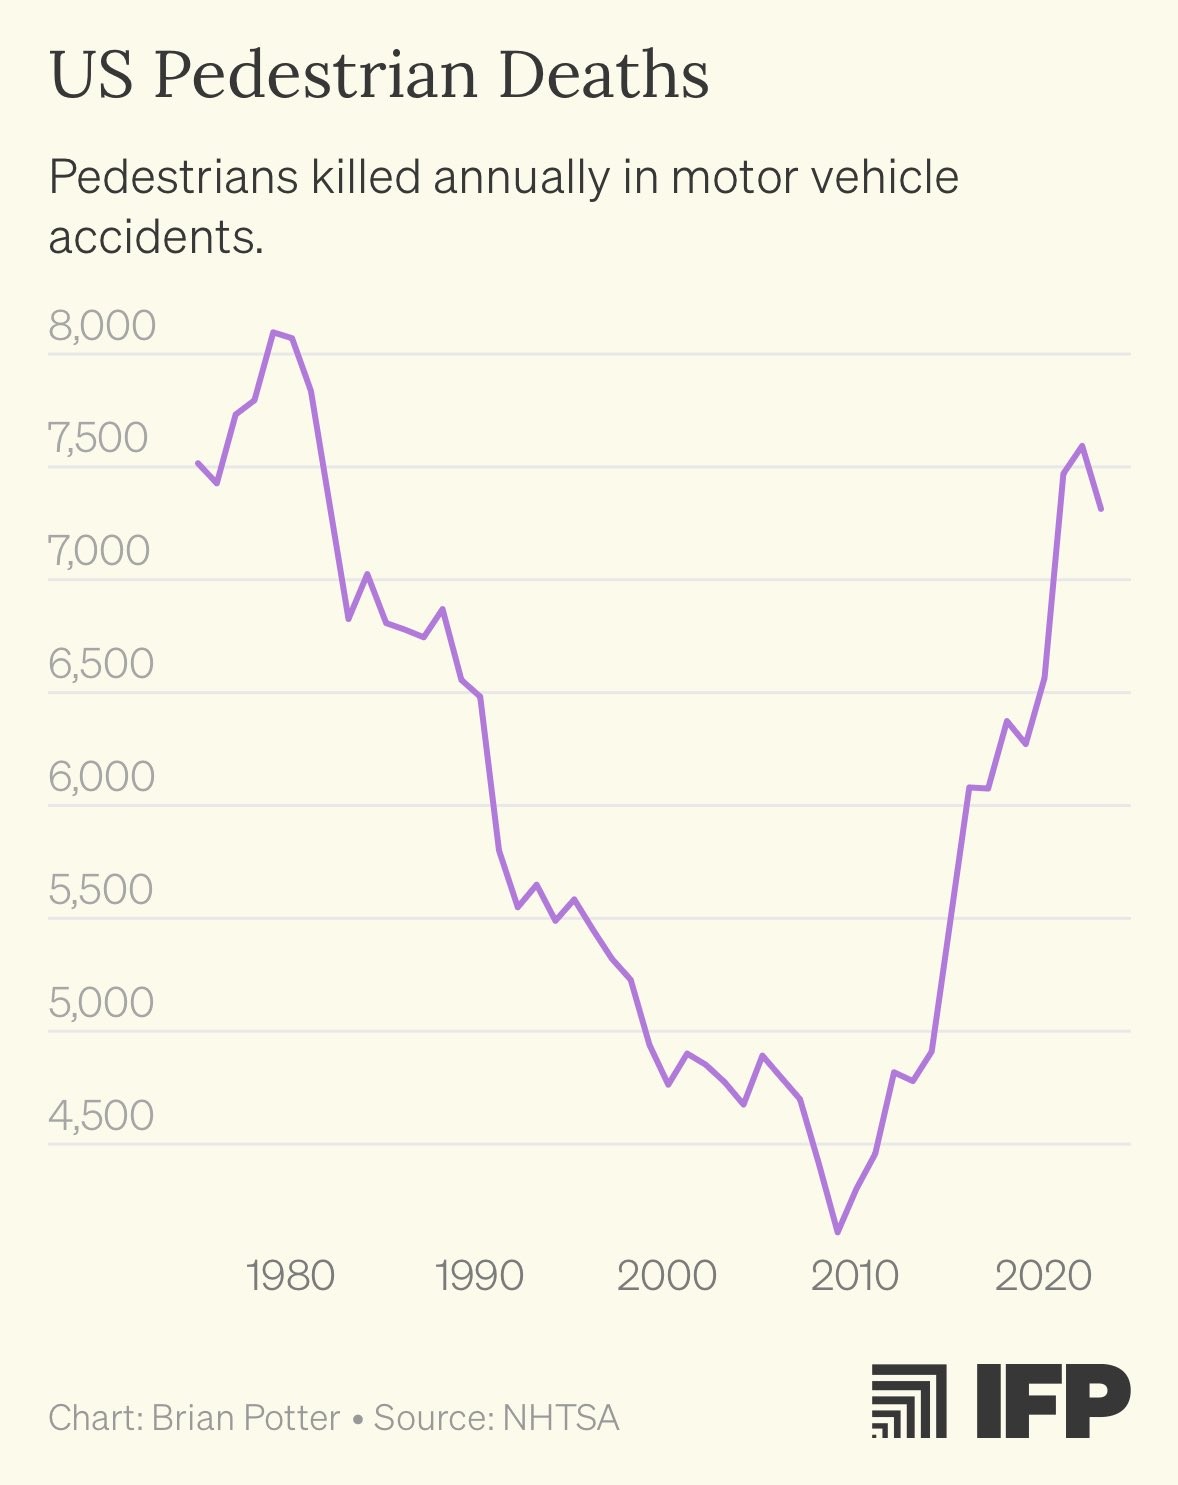
The Picard Maneuver@piefed.world to Just Post@lemmy.worldEnglish · 4 months agoWhat the hell happened around 2010? Smartphones? media.piefed.worldimagemessage-square116linkfedilinkarrow-up1287arrow-down17
arrow-up1280arrow-down1imageWhat the hell happened around 2010? Smartphones? media.piefed.worldThe Picard Maneuver@piefed.world to Just Post@lemmy.worldEnglish · 4 months agomessage-square116linkfedilink
minus-squareimetators@lemmy.dbzer0.comlinkfedilinkEnglisharrow-up21arrow-down1·4 months ago[https://www.statista.com/statistics/199980/us-truck-sales-since-1951/](If anyone is searching for an answer why.) Funny how it is almost the same curve.
minus-squareLightfire228@pawb.sociallinkfedilinkarrow-up10arrow-down1·4 months agoCorrelation is not causation There could be a 3rd driving force that’s causing both trends, among other possible explanations
minus-squarewebpack@ani.sociallinkfedilinkarrow-up5arrow-down1·4 months agoI think the general consensus is that bigger and more dangerous cars causes more pedestrian deaths.
minus-squareLightfire228@pawb.sociallinkfedilinkarrow-up3·4 months agoI wouldn’t be surprised if that was the case but a correlation (as presented in the first comment) is not a valid explanation (again, as is presented in the comment)
minus-squareHadriscus@jlai.lulinkfedilinkarrow-up3arrow-down1·4 months agoIt’s good practice 👍🏼 but I probably go for the trucks explanation here
minus-squareUngraded@lemmy.mllinkfedilinkEnglisharrow-up1·3 months agoWhy? The curves only correlate after 2010. General increase in car ownership might explain both, more deaths and increased truck sales.
minus-squareUngraded@lemmy.mllinkfedilinkEnglisharrow-up1·3 months agoTruck sales were increasing until about 2007 but road deaths only rose since ~2010. So I think it is clearly different curves.


[https://www.statista.com/statistics/199980/us-truck-sales-since-1951/](If anyone is searching for an answer why.) Funny how it is almost the same curve.
Correlation is not causation
There could be a 3rd driving force that’s causing both trends, among other possible explanations
I think the general consensus is that bigger and more dangerous cars causes more pedestrian deaths.
I wouldn’t be surprised if that was the case
but a correlation (as presented in the first comment) is not a valid explanation (again, as is presented in the comment)
It’s good practice 👍🏼 but I probably go for the trucks explanation here
Why? The curves only correlate after 2010.
General increase in car ownership might explain both, more deaths and increased truck sales.
Truck sales were increasing until about 2007 but road deaths only rose since ~2010. So I think it is clearly different curves.